
Novel Platforms of Multiplexed Immunofluorescence for Study of Paraffin Tumor Tissues
Edwin Roger Parra
Department of Translational Molecular Pathology, The University of Texas MD Anderson Cancer Center, Houston, Texas, USA
Abstract
Multiplexed immunofluorescence (IF) methods to detect simultaneously different molecules are revolutionizing immunohistochemistry (IHC) in the last years. These new technologies can be valuable for tumor examination in formalin-fixed paraffin-embedded (FFPE) specimens, and for improved new treatment discoveries and translational cancer studies. The aim of this mini-review is to highlight the recent methodologies that using multiplexed IF to study simultaneous proteins identification in FFPE tumor tissues to clinical research and potential translational analysis. Multiplexed IF methods, which permit the identification of up to 4 proteins at the same time, have been increased in the last years the abilities of study cells by cells and their spatial distribution in several tumor tissues. Although, most of the old platforms are not more used after the powerful multiplex IHC methods are continue growing, the basis of these old methodologies have helped to improve the new technologies. Associated with image analysis software’s these technologies can be improved to performance high throughput assay to study these specimens. Each multiplexed IF technique, detailed herein, is associated with important advantages in cancer study as well as translational research studies.
Introduction
In the last years, different multiplexed methodologies had been emerged for cell and tissue simultaneous identification, these immunohistochemistry (IHC) techniques had been permitted the identification of simultaneous antigen markers in formalin-fixed paraffin-embedded (FFPE) tissue to benefit many different scientific areas for clinical use as therapeutic and diagnostic purposes, as well as, research studies, translational approaches and personalized medicine1-5. An important increase in the number of color labels simultaneously used to identify different protein in FFPE tissue can be achieved with different modern processes that allows the colorful visualization of up to 4 labels of antigens on different type of tissue5. Attempts are presently being made to develop even more comprehensive IHC-based technologies that allow simultaneous visualization of an even larger number of antigens from a single tissue section, as well as to streamline, automate, and reduce the time expended on tissue staining and processing. Multiplexed methods help achieve these technological goals to ultimately enhance disease diagnosis and better inform timely patient care6.
Multiplexed IHC technologies are being used to identify the presence of multiple biological markers on a single tissue sample or an ensemble of different tissue samples7. Histological examination of many clinically relevant tissues types, such as sections of tumors, often require identification of complex expression patterns of multiple biomarkers. This mini-review will briefly provide an overview of the most standard multiplexed IF methods that currently are using to analyze simultaneous proteins in FFPE tumor tissues. From the low-level of multiplexed methods, such as 4-label multiplexing, that have been executed with relatively conventional reagent-based techniques to high-level of multiplexing methods in FFPE tissues showing extraordinary accuracy and complexity. Finally, automated systems and image analysis software’s will be showing to integrate the image acquisition and data analysis of those multiplexing tissue samples.
Multiplex staining bleaching techniques
Different sequential staining techniques using bleaching procedures were created with different variations to study FFPE tissue specimens. When the staining of one marker is done the tissue is treated with bleaching methodologies and then a new marker is staining, the process can be repeated several time, to identify multiple antigens in a single sample.
Multi-epitope-ligand cartography
Described previously, the multi-epitope-ligand cartography (MELC)8,9, is one of these bleaching techniques, that is capable to map the location of different proteins in one sample of cells or tissues using sequential rounds of fluorescent detection10. In each cycle, a couple of antibodies are added; phase contrast and fluorescence images then are acquired by a high-sensitivity “charged Coupled Device”, a sensor used in digital cameras to record images; the sample is washed with phosphate buffer saline and bleaches at the excitation wavelengths; and post bleaching phase contrast and fluorescence images are acquired. An important limitation of MELC technique is that the photobleaching step can only be applied to the microscope's field of view, meaning that the multiprobe image is limited to a single microscopic medium-to-high power field11.
Sequential immunoperoxidase labeling and erasing
Sequential immunoperoxidase labeling and erasing (SIMPLE) is another sequential labeling bleaching technique that enables the simultaneous markers visualization11. The SIMPLE can mixed at list five markers using alcohol-soluble peroxidase substrate 3-amino-9-ethylcarbazole, combined with a fast non-destructive method for antibody–antigen separation, then in each labeling, a given precipitate is gave a pseudocolor, and all colors are overlapped at the end of the process to visualize all the target antigens used. This method showed the ability to erase the results of a single IF stain while preserving tissue antigenicity for repeated rounds of labeling11.
MultiOmyx platform
Created by General Electric Global Research has developed a bleaching technology platform called MultiOmyx, (Figure 1A, Table 1) that use antibodies conjugated with fluorescent dyes to stain several proteins of interest in batches of two to four at the same time. After finish the first stain, the tissue image is captured and deactivation of the fluorescent dyes via alkaline oxidation is done. The platform can then stain the next round of antibodies and is repeat the same procedure several time until finished the desired targets in a multiplexed iterative manner12,13.
Table-1. Staining Systems
| Vendor | Autostainer | Method |
|---|---|---|
| Neo Genomics | MultiOmyx | IF Erasing Staining |
| Leica Biosystems | BOND RX | IHC, IF, FISH, ISH staining |
| Ventana | DISCOVERY ULTRA | Simultaneous IHC, ISH, SISH, Dual Stain, and FITC Slide Processing |
| Agilient/DAKO | DAKO Autostainer Link 48 | IHC, IF, ISH Staining |
Note: IHC= Immunohistochemistry, IF = Immunofluorescence, FISH = Fluorescence in situ hybridization, ISH = In situ hybridization.
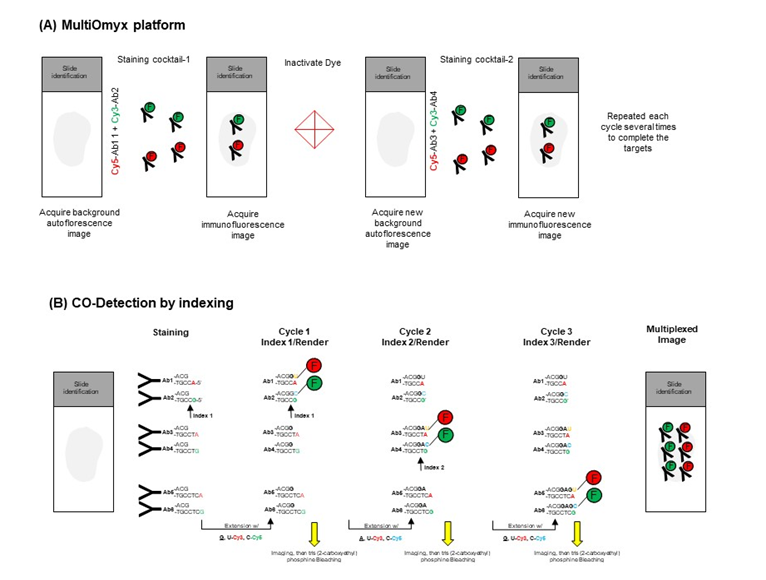
Figure 1: Schematic staining procedure from MultiOmyx and CODEX platform. (A) MultiOmyx platform showing steps of staining, image acquired to remove the background tissue autofluorescence before sub sequential rounds of staining of primary antibodies (Ab) conjugated with fluorescent dyes. Stained images are then acquired, followed by dye inactivation, background tissue autofluorescence image acquired, and re-staining procedure is repeated until all target are concluded. (B) Fluorescent nucleotides are added along the first indexing nucleotide G in the antibodies (Ab) 1 and 2. Cells are washed of free nucleotides and the slide is imaged. A clearing step is performed using tris (2-carboxyethyl) phosphine which cleaves the disulfide linkers to release the fluorophores and then a new indexing cycle 2 is doing in T nucleotide (Ab3 and Ab4) for fluorescent nucleotides U and C to be incorporated onto Abs 3 and 4. The cycle is repeated, using the index by the position G in the Ab5 and Ab6 with fluorescent nucleotides to start another cycle.
CO-Detection by indexing
CO-Detection by indEXing (CODEX) is a new and recently imaging approach that use antibodies labeled with oligonucleotide duplexes that encode uniquely designed sequences with 5’ overhangs14. As described by the authors14, cells are stained with a cocktail containing all tagged antibodies at the same time. During iterative cycles of visualization of labeling the sequence of the 5’overhang determines the index (the combination of a polymerization cycle and a fluorescent channel) at which a given DNA tag incorporates one of two fluorescently labeled dNTP species. Specifically, the antibody-matched overhangs (indexes) include a region to be filled by blank letters and a dedicated position for a dye labeled nucleotide at the end. The antibodies to be revealed first generally have shorter overhangs than the antibodies to be visualized later (Figure 1B). The platform can be performed on any three-color fluorescence microscope enabling conversion of regular fluorescence microscope into a tool for multidimensional tissue rendering and cell cytometry14, giving a good advantage to user this platform.
Multiplex signal amplification techniques
Multiplex modified hapten-based
Modified-hapten based technology is a recent technique that allows simultaneous detection of multiplex biomarkers using a standard two-step procedure (Figure 2A). The technique is antibody species independent and the signal of the markers can be strongest than usually observed with direct flour-labeled secondary antibodies detection of multiplex. Created by Cell IDx company, primary antibodies are combined in cocktails and then detected with a panel of anti-hapten secondary antibodies, each labeled with a different fluorochrome, taking two-hour of procedure15, is a principal advantage of this multiplexed method.
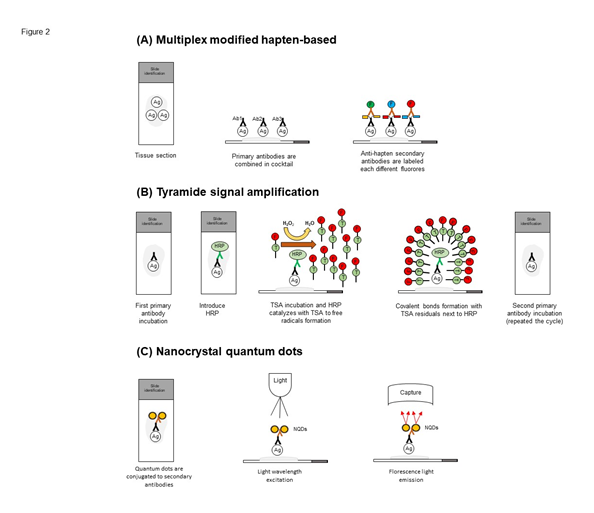
Figure 2: Schematic workflow staining procedure from multiplex modified hapten-based, tyramide signal amplification and nanocrystal quantum dots platform. (A) Simultaneous detection of multiple biomarkers using a standard two-step procedure. Primary antibodies are combined in cocktails and then detected with a panel of anti-hapten secondary antibodies each labeled with a different fluor are used to obtain high stain procedure in a single slide. (B) The HRP-conjugated secondary antibody binds to an unconjugated primary antibody specific to the target/antigen of interest. Detection is ultimately achieved with a fluorophore-conjugated tyramide molecule that serves as the substrate for HRP. Activated tyramide forms covalent bonds with tyrosine residues on or neighboring the protein of interest and is permanently deposited upon the site of the antigen. The method allows for serial stripping of the primary/secondary antibody pairs, while preserving the antigen-associated fluorescence signal, making this process amenable to multiple rounds of staining in a sequential fashion. (C) Quantum dots are conjugated to secondary antibodies to engage the targets before light wavelength excitation. The fluorescence light generated by this combination is capture and analyzed.
Tyramide signal amplification
Tyramide signal amplification (TSA) was described in the 1990s by Bobrow and colleagues16,17. It is an enzyme-linked signal amplification method that conventional is using to detect and localize low copy number of proteins present in tissue by IHC, using most commonly alkaline phosphatase or horseradish peroxidase (HRP) to catalyse the deposition of labelled tyramide molecules at the site of probe or epitope detection. Tyramides can be conjugated to biotin or fluorescent labels and labeled with streptavidin enzyme HRP6,18. The HRP catalyzes the formation of tyramide into highly reactive tyramide radicals that covalently bind to electron-rich tyrosine moieties on FFPE tissue. Tissue surfaces with anchored biotinylated tyramide, must be further treated with fluorescent or enzyme tagged proteins that have a high affinity for biotin as streptavidin before to microscopic visualization6,18. The detection of the proteins is increased more than 10-times compared to standard biotin-based staining methods19.
Perkin Elmer developed the Opal™ workflow (Figure 2B), which allows simultaneous staining of multiple biomarkers within a single paraffin tissue section. The protocol allows researchers to use antibodies raised in the same species, and different panels (Figure 3) combined different targets can be created using this technology4,18. The approach, in the manual protocol, involves detection with fluorescent TSA reagents, followed by microwave treatment that removes any nonspecific staining and reduces tissue autofluorescence for each antibody cycle. In the automated protocol using Leica Bond RX or another autostainers (Table 1) the time is reduced drastically when compared with manual staining.
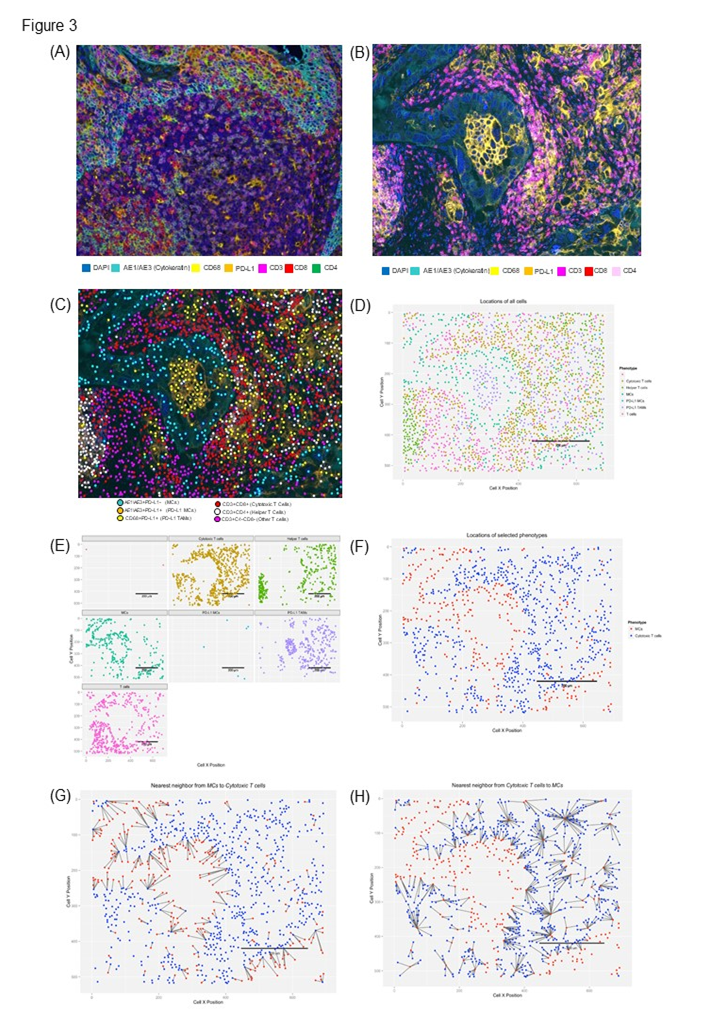
Figure 3: Microphotographs of representative examples of multiplexed immunofluorescence providing important and efficient means to study different characteristics in paraffin tissues. (A) tonsil tissue used as a control for multiplexed validation (lymphocyte targets), (B) lung cancer tissue showing 7 color markers to identify different cells populations, (C) cell populations immune phenotyping, (D) spatial distribution visualization of different phenotypes analyzed, (E) distribution of individual cells using X and Y position, (F) spatial localization of selected cells, and (G and H) distance measurements between two cells populations.
Nanocrystal quantum dots
The method uses specially coated nanocrystals (around 1-10 nm in diameter), called quantum dots, instead of the chromogen20,21. Nanocrystal quantum dots have the property of being excited by any type or wavelength of light to emit light in a very thin fluorescence spectrum (Figure 2C). These fluorescent markers in combination with multispectral imaging technology has been a particular utility for multiplexed detection when used as a fluorescent probe bound to different antibody markers22,23. Despite the favorable optical properties of nanocrystal quantum dots, as a fluorescence-based method, it can avoid endogenous autofluorescence associated with tissue sections24, have high photostability25>, and a symmetric emission spectrum26. An important limitation reported of using nanocrystal quantum dots is the limited number of nanocrystals that possess the proper chemistry to attach themselves to their targeted molecule.
Mass Spectrometry Imaging
Mass spectrometry imaging (MSI) is a technique used in mass spectrometry to visualize the spatial distribution of chemical compositions, e.g. compounds, biomarkers, metabolites, peptides or proteins by their molecular masses27. MSI techniques can vaporize molecules from within specific regions of tissues into gas phase-ions, and then measure their mass. By iteratively scanning across the entire tissue section, an image of the molecules that initially resided in each region of a tissue, prior to vaporization, can be reconstructed27.
Mass Cytometry
Mass cytometry, or CyTOF (Fluidigm), is a variation of flow cytometry in which antibodies are labeled with heavy metal ion tags rather than fluorochromes28. Readout is by time-of-flight mass spectrometry (Figure 4A). This allows for the combination of many more antibody specificities in a single tissue samples or cell sample, without significant spillover between channels. Traditional labeling techniques can be used in this technique with minimal change to current protocols doing the panel design more easy, and no autofluorescent is detected with the CyTOF because the cells do not contain lanthanide ions inside29. Although, slower acquisition is observed (1,000 events per second) compared to traditional flow cytometry is expected and all biological material is vaporized the CyTOF represents a new way of measuring and phenotyping cells. It takes what is familiar (labeling cells) and extends the dimensionality of the data to over twice as many parameters as that of traditional fluorescent flow cytometry30.
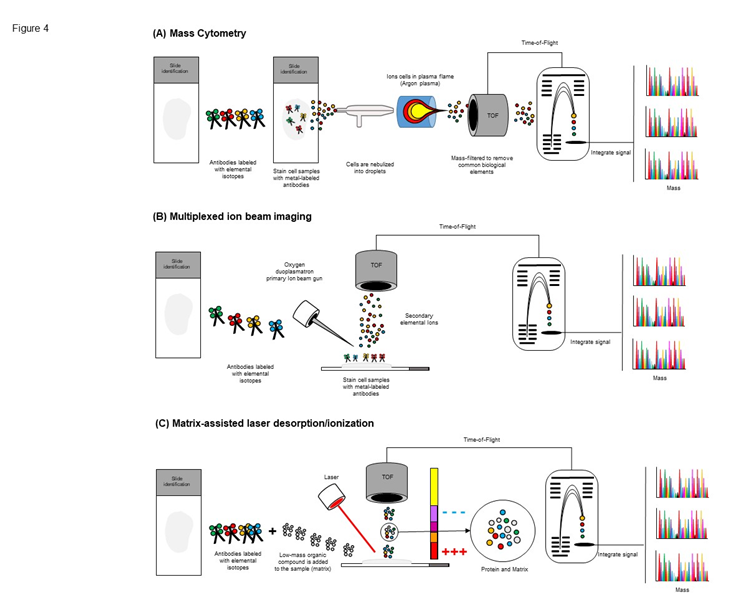
Figure 4: Schematic workflow staining procedure from mass cytometry, multiplexed ion beam imaging and matrix-assisted laser desorption/ionization platform. (A) Different samples can be barcoded with unique combinations of heavy metal tags, enabling them to be pooled together prior to staining to minimize technical variability at this step. The samples are incubated with antibodies targeted against proteins of interest. The cells are nebulized into droplets as they are introduced into the mass cytometer. They then travel into an inductively-coupled argon plasma, in which covalent bonds are broken and ions are liberated. The ion cloud is filtered to remove common biological elements and enrich the heavy metal reporter ions to be quantified by time-of-flight mass spectrometry. Ion signals are integrated on a per-cell basis, resulting in single-cell measurements for downstream analysis. (B) Similar to mass cytometry, samples can be barcoded with unique combinations of heavy metal tags, dried and loaded under vacuum. The samples is raterized with an oxygen ion beam that sputters the antibody-specific isotope reports native to the sample surface as secondary ions. Metal-conjugated antibodies are quantified via replicate scan of the same field of view, where up to seven metal reporters are menstruated with each scan. (C) Samples are added to the MALDI plate, overlaid with matrix, and dried, the sample is bombarded by the laser. This bombardment results in the sublimation and ionization of both the sample and matrix. These generated ions are separated based on their mass-to-charge ratio via a TOF tube, and a spectral representation of these ions is generated and analyzed by the MS software, generating an MS profile.
Multiplexed ion beam imaging
Multiplexed ion beam imaging (MIBI) is capable of analyzing samples stained simultaneously with up to 100 metal-isotope labeled antibodies and is compatible with standard FFPE tissue sections31. Depending on the element of interest, MIBI can achieve as low as parts-per-billion sensitivity with a dynamic range of 105 and resolution comparable to high-magnification light microscopy. Instead of fluorophores or enzyme-conjugated reagents, biological specimens are incubated with primary antibodies coupled to stable lanthanides highly enriched for a single isotope32. Primary antibodies are combined in solution for simultaneous incubation with the specimen. The specimens prepared are mounted in a sample receptacle and subjected to a rasterized oxygen duoplasmatron primary ion beam (Figure 4B). As this ion beam strikes the sample lanthanide adducts of the bound antibodies are released as secondary ions. The secondary ions can be analyzed via a magnetic sector mass spectrometer equipped with multiple detectors to allow the multiple lanthanide isotopes detection. The platform has a number of advantages over conventional multiplexed techniques, as there is not background because the absents of autofluorescence and the signal for the image have a very good definition33.
Matrix-assisted laser desorption/ionization
Matrix-assisted laser desorption/ionization (MALDI) mass spectroscopy can identify the presence of multiple proteins, peptides and small molecules within biological tissues in an unbiased manner, meaning without having to pre-select antibodies or other detection-biasing reagents34. MALDI is a soft ionization technique that uses an organic compound matrix that when combined with pulsed UV laser irradiation promotes efficient desorption and ionization of molecules from vaporization of the matrix34-36, (Figure 4C). There are important application of this technology in research and clinical applications, such as identification of bacterial and fungal isolates from a single colony37, identification of mutations, single-nucleotide polymorphisms, insertion/deletion, alternative splicing, quantitative changes variation, gene expression, allele expression, methylation of genomic DNA, posttranscriptional modification of tRNAs and rRNAs,38,39. A combination of tissue antibodies staining and MALDI techniques was used to co-localize anticancer drugs40. Limitations of the direct MALDI imaging of tissues are the relatively low sensitivity of the method and the inability to quantitatively compare signals from different antigen molecules to each other due to differences in ionization characteristics.
Image approaches and data analysis platforms
Although, multiplexed IHC staining available for FFPE material enables multi-parametric readouts from a single tissue section, the different techniques described before, have some tines limited scalability and throughput, related to limited small region-of-interests (ROI) scanning or limited to few number of fields-of-views41,42 as summarized in the Table 2. The major part of the scanner system (Table 3) provided high quality of monochrome cameras with high-resolution and multi-band filter cubes set that provided greater flexibility, to match with the sample. Fluorescence scanners support multiple filters using mechanical switching or using tunable LED excitation, similar to confocal microscope, the capture signals are assemble in a compose image43. Although, the scanner system can capture the ROI area using one filter at the time or changes the filter at each capture to high channel of co-localization42, is still impossible to accelerate the process of the scanning to obtain high quality of images and it is variable depending the methodology used in the scanning that can takes from minutes to serval hours44. Analysis software’s are also important to extract high quality of information from these simultaneous detection and multiplex co-localization markers. An important number of image analysis systems combined with automated scanning, are increasingly being employed to take advantages of the multiplexed IHC methodologies as Vectra/InForm18, Hamamatsu45,46, MultiOmyx47, Bacus TMAScore, Dako ACIS III, Genetix Ariol, Aperio FL, 3DHistech Mirax HistoQuant,46, all of which can scan slides affixed to whole tissue or tissue microarray slices prior to image analysis. Image analysis software’s (Table 4) need to accessible, easy with automated capabilities of detection, including tissue segmentation and spatial co-localization cell distribution, critically important to study in particular small samples, such as core needle biopsies or small metastatic tumor samples (Figure 3). High resolution performance during the multiplexing analysis across the ROI or whole section are also important during the analysis. In the same way, comprehensive evaluation using these different techniques not only needed to clear antigens demarcation, good staining procedures but also good interpretation of the results. Pathologist are very important and need to be standardized the possible inter-observed variation48,49 when are using different analysis platforms during the co-localization of proteins.
Table-2. Advantage and disadvantages with the different multiplexed staining methods
| Multiplex Staining Methods | Advantage | Disadvantage |
|---|---|---|
| Multiplex staining bleaching techniques | ||
| Multi-epitope-ligand cartography |
• Allows colocalization and detection of a large number of proteins. • High functional resolution. |
• The multiprobe image is limited to a single microscopic medium-to-high power field.
• Sampling time longer. • The method requires a robotic staining integrated with an inverted fluorescence microscope (high cost). |
| Sequential immunoperoxidase labeling and erasing | • Allows the analysis of a large number of multiple antigens.
• Compatible with primary antibodies from same species. |
• Maximum five antibody labels per section. |
| MultiOmyx platform | Allows the analysis up to 60 biomarkers in a single slide | Cycles of two antibodies with sampling scan longer. |
| CO-Detection by indexing | • Eliminate autofluorescence
• Allows the analysis of several markers |
• Scan sampling longer.
• Limited use in FFPE tissues |
| Multiplex signal amplification techniques | ||
| Multiplex modified hapten-based | • Fast staining around 2 hours.
• Cocktails of markers. |
• Allows maximum 4 markers per slide.
• Not tested to autostainer |
| Tyramide signal amplification | • Compatible with primary antibodies from same species.
• Available for autostainer. |
• Allows maximum 7 label antibodies per slide. |
| Nanocrystal quantum dots | • Eliminate autofluorescence. | • Limited nanocrystals. |
| Mass Spectrometry Imaging | ||
| Mass Cytometry | • Eliminate sample autofluorescence.
• Preprocessing using routine immunohistochemistry protocols. • The signals are plotted using coordinates of each single laser shot.• No amplification step of the signal needed. • No matrix needed |
• Current limitations are availability of antibodies, sampling time and resolution. |
| Multiplexed ion beam imaging | • Simultaneous labeling up 100 antibodies with metals. | • Sampling time and small area sampling. |
| Matrix-assisted laser desorption/ionization | • Organic compound matrix used. | • Sampling time and resolution. |
Table-3. Multiplex Imaging scanning products
| Company | Imaging name | Program | Corporate location/notes |
|---|---|---|---|
| Leica Biosystems | Aperio FL | ScanScope | Ilinois, USA |
| 3DHistech | Pannoramic | Pannoramic | Budapest, Hungary |
| Ventana/Roche | BF, FL | iScan | USA, International |
| PerkinElmer | Vectra/Polaris multispectral BF, FL | Vectra/Polaris | Boston, USA |
| Huron Technologies | BF, FL | TISSUEscope 4000 | Ontario, Canada |
| Hamamatsu | BF, FL | Nanozoomer | Japan |
| MetaSystems | BF, FL | Metafer | Germany |
| MikroScan Technologies | BF, FL | MikroScan | California, USA |
| Olympus America | BF, FL | VS110, Nanozoomer (USA) | Japan, International |
| TissueGnostics | BF, FL | TissueFAXS, HistoFAXS | Vienna, Austria |
| Zeiss | BF, FL | AxioVision MosaiX | USA, Germany |
| IONPATH | MIBI | Multiplexed Ion Beam Imaging | Boston, USA |
| FLUIDIGM | Helios | CyTOF System | USA, international |
| Bruker | MALDI | MALDI-TOF Mass Spectrometry | USA, international |
Note: BF=Bright Field, FL=Fluorescence, MALDI=Matrix-Assisted Laser Desorption/Ionization
Table-4. Image analysis software systems
| Vendor | Program name | Method | Availability |
|---|---|---|---|
| Leica Biosystems | Aperio Image Analysis IF | Cellular, Area Quantification and Positive Pixel Count IF Algorithms | Licensed |
| Definiens | Tissue Studio | Imaging Segmentation, Marker Intensity Measurement, and Statistical Analysis | Licensed |
| Indica Labs | HALO | Membrane, Co-localization, Immune Cell Proximity, Spatial Analysis | Licensed |
| Visiopharm | Visimoph Tissuemorph | Signal Intensity, Area, Counting Objects, Statistical Analysis | Licensed |
| 3DHistech | HistoQuant | Color Based /Morphometry Based Selection | Licensed |
| PerkinElmer | InForm | Color Based Co-localization, Tissue, Cell Segmentation | Licensed |
| Spot Imagine | Spot advanced | Color Based Co-Localization | Licensed |
| FARSIGHT | Nucleus Editor | Multichannel Based Object Identification/Toolkit | Free |
| NIH | Image J | Color Based, User Interactive Segmentation | Free |
| Media Cybernetics | Image-Pro | Color Based, Flexible, Macro-enabled Advanced Image Processing Solution | Licensed |
| Neo Genomics | MultiOmyx | Composed Image, Quantification Algorithms | Licensed |
| HistoRx | AQUAnalysis | Signal Intensity Per Unit are Per Layer | Licensed |
| CompuCyte | iCyte | Nucleus Segmentation or Phantom Contouring, Measuring Associated Signals | Licensed |
Conclusion
Multiplexed IHC methods can provide important and efficient means to apply in diagnosis disease and translational research. These system more and more are showing different capabilities from research labs towards the clinic, increase the opportunity to understand much better the tumor interactions. Multiplexed IHC and image analysis strategies can allow an important information about co-localizations, spatial-pattern distribution in the tumor microenvironment. In the other way, development of these new methods require a multidisciplinary team very well training including pathologists, oncologists, and immunologists. In addition, these methodologists require automation to provide efficient and fast information as wells as easy analysis methodologist for research pathologist to use highly-multiplexed methods.
Granulocyte-macrophage colony-stimulating factor (GM-CSF)-secreting, allogeneic PDAC vaccine (GVAX), PEGPH20 (PEGylated human recombinant hyaluronidase), gem (Gemcitabine), HA (hyaluronic acid), programmed cell death ligand-1 (PD-L1) and cytotoxic T-lymphocyte-associated antigen-4 (CTLA-4)
References
- Steiner C, Ducret A, Tille JC, et al. Applications of mass spectrometry for quantitative protein analysis in formalin-fixed paraffin-embedded tissues. Proteomics. 2014; 14(4-5): 441-51.
- Stauber J, MacAleese L, Franck J, et al. On-tissue protein identification and imaging by MALDI-ion mobility mass spectrometry. J Am Soc Mass Spectrom. 2010; 21(3): 338-47.
- Sood A, Miller AM, Brogi E, et al. Multiplexed immunofluorescence delineates proteomic cancer cell states associated with metabolism. JCI Insight. 2016; 1(6).
- Gorris MAJ, Halilovic A, Rabold K, et al. Eight-Color Multiplex Immunohistochemistry for Simultaneous Detection of Multiple Immune Checkpoint Molecules within the Tumor Microenvironment. J Immunol. 2017.
- Rost S, Giltnane J, Bordeaux JM, et al. Multiplexed ion beam imaging analysis for quantitation of protein expresssion in cancer tissue sections. Lab Invest. 2017; 97(8): 992-1003.
- Stack EC, Wang C, Roman KA, et al. Multiplexed immunohistochemistry, imaging, and quantitation: a review, with an assessment of Tyramide signal amplification, multispectral imaging and multiplex analysis. Methods. 2014; 70(1): 46-58.
- Dixon AR, Bathany C, Tsuei M, et al. Recent developments in multiplexing techniques for immunohistochemistry. Expert Rev Mol Diagn. 2015; 15(9): 1171-86.
- Schubert W, Bonnekoh B, Pommer AJ, et al. Analyzing proteome topology and function by automated multidimensional fluorescence microscopy. Nat Biotechnol. 2006; 24(10): 1270-8.
- Friedenberger M, Bode M, Krusche A, et al. Fluorescence detection of protein clusters in individual cells and tissue sections by using toponome imaging system: sample preparation and measuring procedures. Nat Protoc. 2007; 2(9): 2285-94.
- Herman B, Krishnan RV, Centonze VE. Microscopic analysis of fluorescence resonance energy transfer (FRET). Methods Mol Biol. 2004; 261: 351-70.
- Glass G, Papin JA, Mandell JW. SIMPLE: a sequential immunoperoxidase labeling and erasing method. J Histochem Cytochem. 2009; 57(10): 899-905.
- Hollman-Hewgley D, Lazare M, Bordwell A, et al. A single slide multiplex assay for the evaluation of classical Hodgkin lymphoma. Am J Surg Pathol. 2014; 38(9): 1193-202.
- Gerdes MJ, Sevinsky CJ, Sood A, et al. Highly multiplexed single-cell analysis of formalin-fixed, paraffin-embedded cancer tissue. Proc Natl Acad Sci U S A. 2013; 110(29): 11982-7.
- Goltsev Y, Samusik N, Kennedy-Darling J, et al. Deep profiling of mouse splenic architecture with CODEX multiplexed imaging. Cell Press. 2017.
- Levin M, Kron SJ, Schwartz D, et al. Rapid 5-marker multiplex phenotyping of breast cancer subtypes & tumor-infiltrating leukocytes "in situ" in FFPE sections. Cancer Res. 2016; 76.
- Bobrow MN, Harris TD, Shaughnessy KJ, et al. Catalyzed reporter deposition, a novel method of signal amplification. Application to immunoassays. J Immunol Methods. 1989; 125(1-2): 279-85.
- Bobrow MN, Shaughnessy KJ, Litt GJ. Catalyzed reporter deposition, a novel method of signal amplification. II. Application to membrane immunoassays. J Immunol Methods. 1991; 137(1): 103-12.
- Parra ER, Uraoka N, Jiang M, et al. Validation of multiplex immunofluorescence panels using multispectral microscopy for immune-profiling of formalin-fixed and paraffin-embedded human tumor tissues. Sci Rep. 2017; 7(1): 13380.
- Faget L, Hnasko TS. Tyramide Signal Amplification for Immunofluorescent Enhancement. Methods Mol Biol. 2015; 1318: 161-72.
- Bostick RM, Kong KY, Ahearn TU, et al. Detecting and quantifying biomarkers of risk for colorectal cancer using quantum dots and novel image analysis algorithms. Conf Proc IEEE Eng Med Biol Soc. 2006; 1: 3313-6.
- Kairdolf BA, Smith AM, Stokes TH, et al. Semiconductor quantum dots for bioimaging and biodiagnostic applications. Annu Rev Anal Chem (Palo Alto Calif). 2013; 6: 143-62.
- Peng CW, Liu XL, Chen C, et al. Patterns of cancer invasion revealed by QDs-based quantitative multiplexed imaging of tumor microenvironment. Biomaterials. 2011; 32(11): 2907-17.
- Liu J, Lau SK, Varma VA, et al. Molecular mapping of tumor heterogeneity on clinical tissue specimens with multiplexed quantum dots. ACS Nano. 2010; 4(5): 2755-65.
- Mansfield JR, Gossage KW, Hoyt CC, et al. Autofluorescence removal, multiplexing, and automated analysis methods for in-vivo fluorescence imaging. J Biomed Opt. 2005; 10(4): 41207.
- Zrazhevskiy P, True LD, Gao X. Multicolor multicycle molecular profiling with quantum dots for single-cell analysis. Nat Protoc. 2013; 8(10): 1852-69.
- Zhang Y, Wang TH. Quantum dot enabled molecular sensing and diagnostics. Theranostics. 2012; 2(7): 631-54.
- Matros A, Mock HP. Mass spectrometry based imaging techniques for spatially resolved analysis of molecules. Front Plant Sci. 2013; 4: 89.
- Di Palma S, Bodenmiller B. Unraveling cell populations in tumors by single-cell mass cytometry. Curr Opin Biotechnol. 2015; 31: 122-9.
- Dempsey LA. CyTOF analysis of anti-tumor responses. Nat Immunol. 2017; 18(3): 254.
- Bendall SC, Simonds EF, Qiu P, et al. Single-cell mass cytometry of differential immune and drug responses across a human hematopoietic continuum. Science. 2011; 332(6030): 687-96.
- Angelo M, Bendall SC, Finck R, et al. Multiplexed ion beam imaging of human breast tumors. Nat Med. 2014; 20(4): 436-42.
- Bandura DR, Baranov VI, Ornatsky OI, et al. Mass cytometry: technique for real time single cell multitarget immunoassay based on inductively coupled plasma time-of-flight mass spectrometry. Anal Chem. 2009; 81(16): 6813-22.
- Rimm DL. What brown cannot do for you. Nat Biotechnol. 2006; 24(8): 914-6.
- Yalcin EB, de la Monte SM. Review of matrix-assisted laser desorption ionization-imaging mass spectrometry for lipid biochemical histopathology. J Histochem Cytochem. 2015; 63(10): 762-71.
- Di Girolamo F, Lante I, Muraca M, et al. The Role of Mass Spectrometry in the "Omics" Era. Curr Org Chem. 2013; 17(23): 2891-905.
- Chan TW, Duan L, Sze TP. Accurate mass measurements for peptide and protein mixtures by using matrix-assisted laser desorption/ionization Fourier transform mass spectrometry. Anal Chem. 2002; 74(20): 5282-9.
- Sauer S, Kliem M. Mass spectrometry tools for the classification and identification of bacteria. Nat Rev Microbiol. 2010; 8(1): 74-82.
- Gao X, Tan BH, Sugrue RJ, et al. MALDI mass spectrometry for nucleic acid analysis. Top Curr Chem. 2013; 331: 55-77.
- Vogel N, Schiebel K, Humeny A. Technologies in the Whole-Genome Age: MALDI-TOF-Based Genotyping. Transfus Med Hemother. 2009; 36(4): 253-62.
- Stauber J, Ayed ME, Wisztorski M, et al. Specific MALDI-MSI: Tag-Mass. Methods Mol Biol. 2010; 656: 339-61.
- Blom S, Paavolainen L, Bychkov D, et al. Systems pathology by multiplexed immunohistochemistry and whole-slide digital image analysis. Sci Rep. 2017; 7(1): 15580.
- Isse K, Lesniak A, Grama K, et al. Digital transplantation pathology: combining whole slide imaging, multiplex staining and automated image analysis. Am J Transplant. 2012; 12(1): 27-37.
- Sanderson MJ, Smith I, Parker I, et al. Fluorescence microscopy. Cold Spring Harb Protoc. 2014; 2014(10): pdb top071795.
- Spindel S, Sapsford KE. Evaluation of optical detection platforms for multiplexed detection of proteins and the need for point-of-care biosensors for clinical use. Sensors (Basel). 2014; 14(12): 22313-41.
- Moles Lopez X, D'Andrea E, Barbot P, et al. An automated blur detection method for histological whole slide imaging. PLoS One. 2013; 8(12): e82710.
- Zheng PP, van der Weiden M, et al. Fast tracking of co-localization of multiple markers by using the nanozoomer slide scanner and NDPViewer. J Cell Physiol. 2014; 229(8): 967-73.
- Ribas A, Dummer R, Puzanov I, et al. Oncolytic Virotherapy Promotes Intratumoral T Cell Infiltration and Improves Anti-PD-1 Immunotherapy. Cell. 2017; 170(6): 1109-19 e10.
- Huang W, Hennrick K, Drew S. A colorful future of quantitative pathology: validation of Vectra technology using chromogenic multiplexed immunohistochemistry and prostate tissue microarrays. Hum Pathol. 2013; 44(1): 29-38.
- Nederlof M, Watanabe S, Burnip B, et al. High-throughput profiling of tissue and tissue model microarrays: Combined transmitted light and 3-color fluorescence digital pathology. J Pathol Inform. 2011; 2: 50.